What's in a Beacon county report
Every page of a real report, the federal data edition for Travis County, TX, as it prints. Each page says what it answers and where its numbers come from.
Your Wrangell City and Borough report has the same pages, with the numbers for Wrangell City and Borough, AK.
Counties outside North and South Carolina get this federal data edition. North and South Carolina counties get the quarterly County Growth Report (see that sample, PDF). See the free Travis County, TX page.
The 5 pages
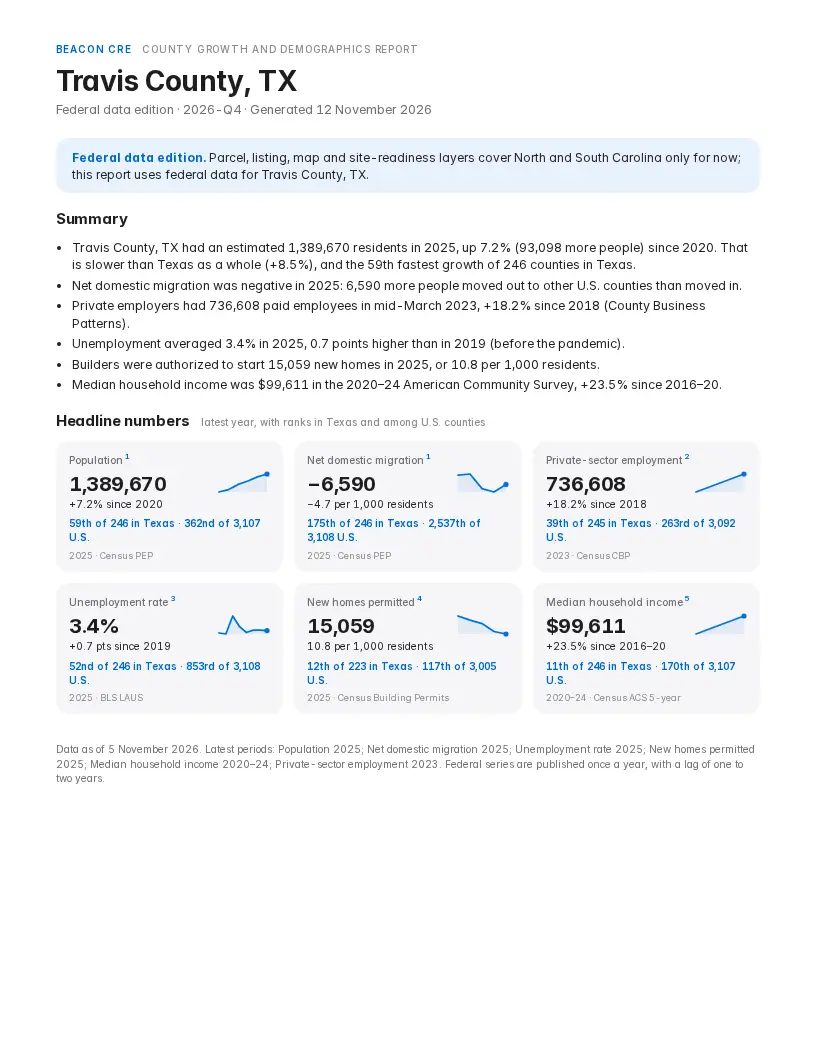
Page 1: Summary, headline numbers and ranks
Is the county growing, and how does it compare? A rules-written summary, then six headline numbers (population, net domestic migration, private-sector jobs, unemployment, homes permitted and median household income), each ranked in its state and among U.S. counties.
Sources: U.S. Census Bureau, Population Estimates Program (Vintage 2025); U.S. Census Bureau, County Business Patterns; U.S. Bureau of Labor Statistics, Local Area Unemployment Statistics; U.S. Census Bureau, Building Permits Survey; U.S. Census Bureau, American Community Survey 5-year estimates.
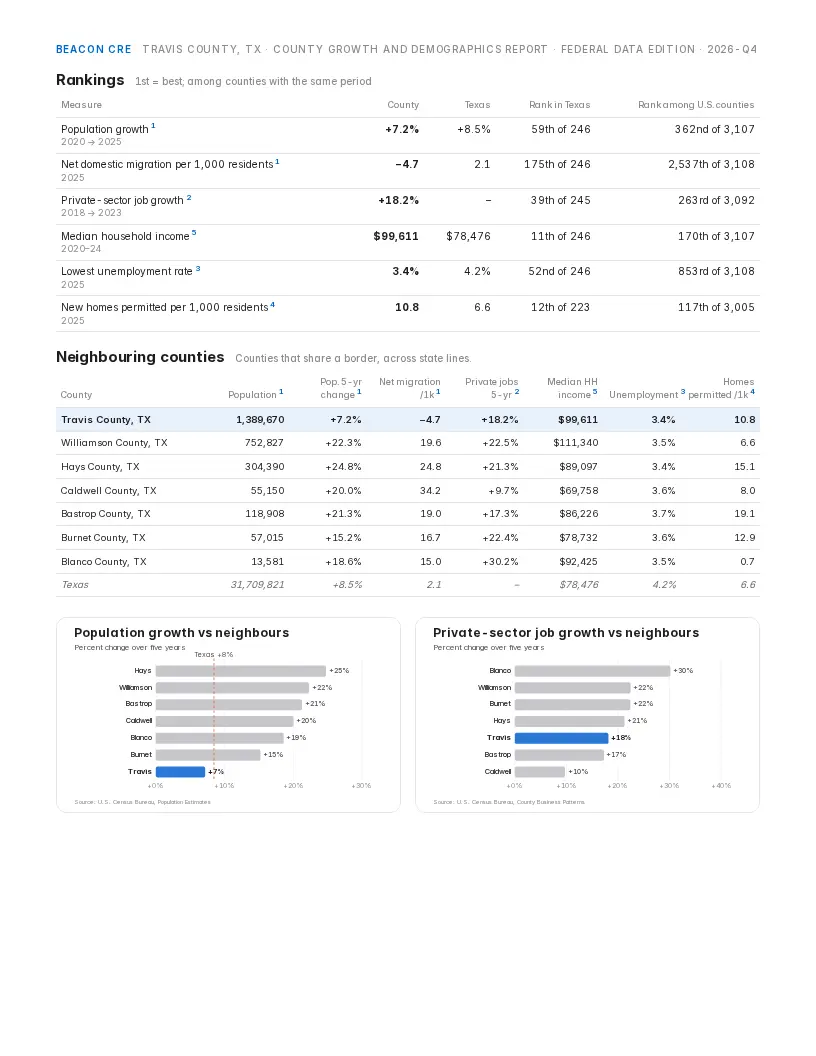
Page 2: Ranks and the neighbouring-county table
Where does it rank on each measure, and how do its neighbours compare? Ranks in the state and the U.S., a table of the counties that share a border, and charts of population and job growth against those neighbours.
Sources: U.S. Census Bureau, Population Estimates Program (Vintage 2025); U.S. Census Bureau, County Business Patterns; U.S. Bureau of Labor Statistics, Local Area Unemployment Statistics; U.S. Census Bureau, Building Permits Survey; U.S. Census Bureau, American Community Survey 5-year estimates.
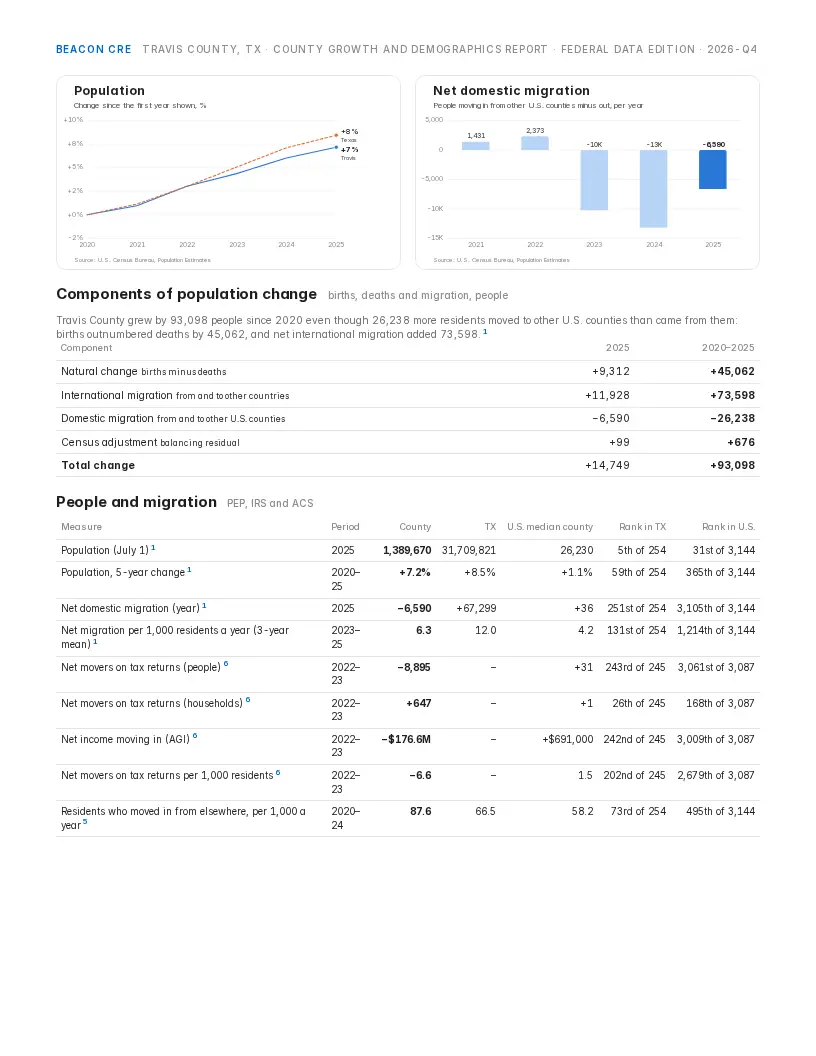
Page 3: Migration, with IRS mover and income flows
Who is moving in and out? Population over time, net domestic migration by year, the components of change (births, deaths, migration) and IRS mover flows: people, households and the income they bring.
Sources: U.S. Census Bureau, Population Estimates Program (Vintage 2025); Internal Revenue Service, Statistics of Income: county-to-county migration; U.S. Census Bureau, American Community Survey 5-year estimates.
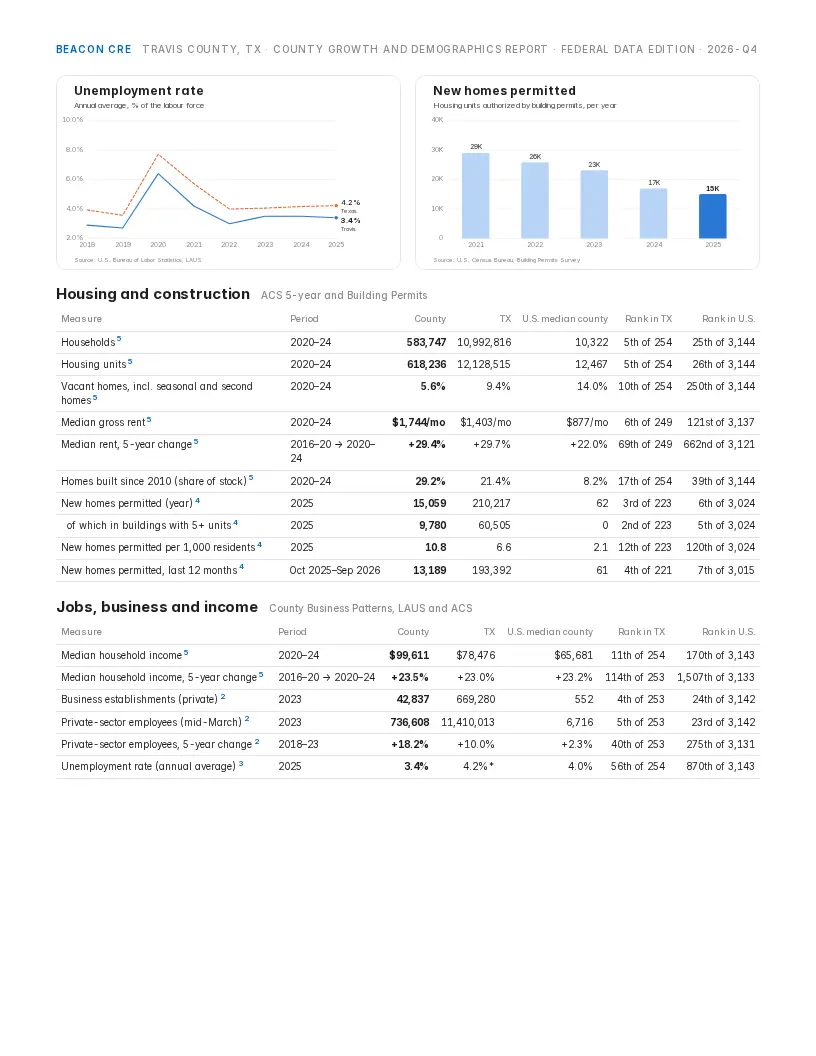
Page 4: Rent, vacant homes, permits and employers
What is happening to housing and jobs? Median rent and its 5-year change, vacant homes, homes permitted (including the last 12 months), private employers and jobs, household income and unemployment, each beside the state and the U.S. median county.
Sources: U.S. Census Bureau, American Community Survey 5-year estimates; U.S. Census Bureau, Building Permits Survey; U.S. Census Bureau, County Business Patterns; U.S. Bureau of Labor Statistics, Local Area Unemployment Statistics.
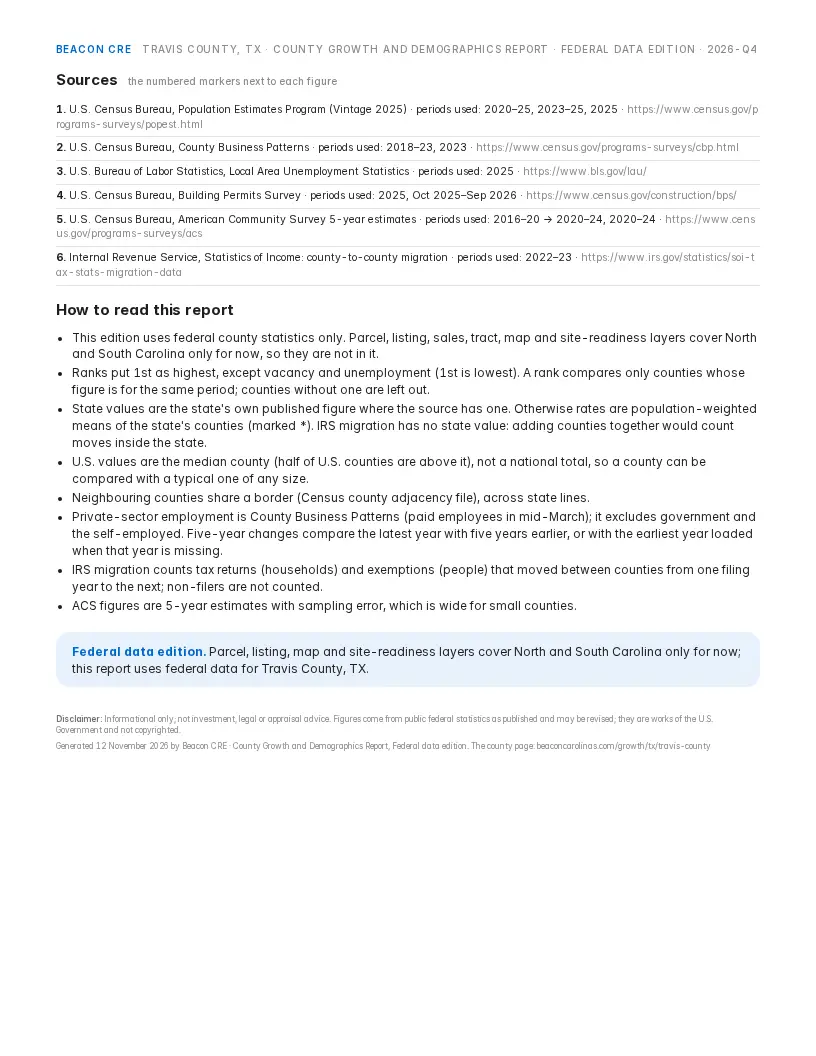
Page 5: Every source and the methods
Where does every number come from? Each numbered source with the periods used, how to read the ranks and state values, and what the report leaves out.
Every source cited in the report, with links.
What you get for $99
$99 once, per county
Pay once, no subscription. The PDF is ready to download right after checkout.
- Population and growth, net domestic migration and IRS mover flows (people, households, income)
- The ACS profile: households, housing units, rents, vacancy and income, with 5-year changes
- Homes permitted by year and in the last 12 months, and private employers and jobs (CBP)
- Unemployment over time beside the state
- Ranks in the state and among U.S. counties, and a comparison with neighbouring counties
- A source and period cited next to every number, and a methods page
- A CSV of every table (values, ranks, sources) for your spreadsheet
- Not useful? Email us within 14 days for a full refund
- Sold by Simply Stats LLC (NC)
- Secure Stripe checkout (Apple Pay/Google Pay)
- Instant PDF download
- PDF + CSV of every table
Refund terms: Terms. · How we compute every number
Figures come from public federal statistics and are informational only, not investment advice. Check the source before relying on a number.
Pick your county
Choose a state, then your county. Each county page has its free numbers, a free preview of page 1 and the button to buy its report.
- Alabama
- Alaska
- Arizona
- Arkansas
- California
- Colorado
- Connecticut
- Delaware
- District of Columbia
- Florida
- Georgia
- Hawaii
- Idaho
- Illinois
- Indiana
- Iowa
- Kansas
- Kentucky
- Louisiana
- Maine
- Maryland
- Massachusetts
- Michigan
- Minnesota
- Mississippi
- Missouri
- Montana
- Nebraska
- Nevada
- New Hampshire
- New Jersey
- New Mexico
- New York
- North Carolina
- North Dakota
- Ohio
- Oklahoma
- Oregon
- Pennsylvania
- Rhode Island
- South Carolina
- South Dakota
- Tennessee
- Texas
- Utah
- Vermont
- Virginia
- Washington
- West Virginia
- Wisconsin
- Wyoming